Use of PK Modeling & Steady-State Simulations in 505(b)(2) Drug Development
Sponsors and their investors continue to seek cost efficient ways to meet their financial milestones. Modeling can be used as a cost effective way to estimate the effect of changing an oral product from immediate release to extended release. Modeling avoids the cost of making multiple formulations and performing several multi-arm pharmacokinetic studies. The following posting was prepared by Stacey Ayres, under the direction of Ruth Stevens, Strategic Advisor to Premier Consulting.
For changes to a previously approved drug product, Section 314.54 permits a 505(b)(2) applicant to rely on the Agency’s finding of safety and effectiveness of the previously approved drug product, coupled with information needed to support the change from the approved product. As such, a 505(b)(2) application should include a bioavailability (BA)/bioequivalence (BE) study(s) comparing the proposed product to the listed product to establish a “bridge” to provide an adequate basis for reliance upon FDA’s finding of safety and effectiveness of the reference listed drug (RLD).
One of the BA/BE requirements for an NDA (e.g., 505(b)(2)) of an extended-release (ER) drug product must ensure that the drug product’s steady-state performance is equivalent to the currently marketed noncontrolled release drug product which is subject to an approved full NDA. The Guidance for Industry: BA and BE Studies for Orally Administered Drug Products — General Considerations recommends that the following BA studies be conducted for an ER drug product submitted as an NDA:
- A single-dose, fasting study on all strengths of the products
- A single-dose, food-effect study on the highest strength
- A steady-state study on the highest strength
505(b)(2) applications for proposed drug products where the rate and/or extent of absorption exceed, or are otherwise different from the approved drug may require additional clinical studies to document safety and efficacy at the different rate and extent of delivery. The ability to predict the ER test formulation’s ability to meet the 505(b)(2) bridging BE requirements under steady-state conditions, using data obtained from initial single-dose study(s) may enhance the efficiency of drug development as well as provide a real cost saving benefit. If an unfavorable outcome is predicted from the modeling, the Sponsor may elect to re-formulate the product prior to conducting any further PK studies.
Integration of PK/PD in early development helps with formulation selection and guides creation of an efficient clinical development strategy. The FDA has clearly emphasized the importance of integrating PK/PD information in drug development and its potential impact on decision-making.(Miller, 2005) The strategic use of PK modeling and steady-state simulation in 505(b)(2) drug development programs could prove valuable.
Based on this approach, the Sponsor elected to use data obtained in the single-dose BA study to model/simulate steady-state conditions for both the test product and RLD (as the FDA requested a PK steady-state BE assessment as part of the 505(b)(2) submission). The goal was to define through PK modeling/simulation whether a twice-a-day (q12), test formulation was bioequivalent (BE) to an immediate-release, 3 times-a-day (q4), RLD formulation at steady-state, including the assessment of the Cmin,ss parameter. Typically Cmax, AUC0-last, and AUC0-inf comparisons between the test product and a RLD are mandated for BE testing. Cmax is the characteristic of the concentration-time curve that FDA uses to represent the rate of absorption. AUC is the characteristic of the concentration-time curve that the Agency uses to determine the extent of absorption. The AUC and Cmaxdata for the test and RLD are analyzed statistically and should demonstrate that they meet United States (US) FDA’s statistical criteria for a determination that the products are BE or have comparative bioavailability. Cmax and AUC for the test product should be within 80 to 125 percent of the RLD using the 90 percent confidence interval (CI).
A BE study consisting of a randomized, two period crossover study in which a single 150mg dose of a controlled-release investigator test product (Treatment A) was given at the beginning of a twelve hour period and compared with a 50mg dose of reference product (Treatment B) given every four hours for three doses was conducted. Of particular interest was estimation of Cmin for both treatments at steady-state from this single dose BE data. For most cases, Cmin is merely assessed. In this case, it was necessary to report and justify Cmin for the simulated multiple dose study.
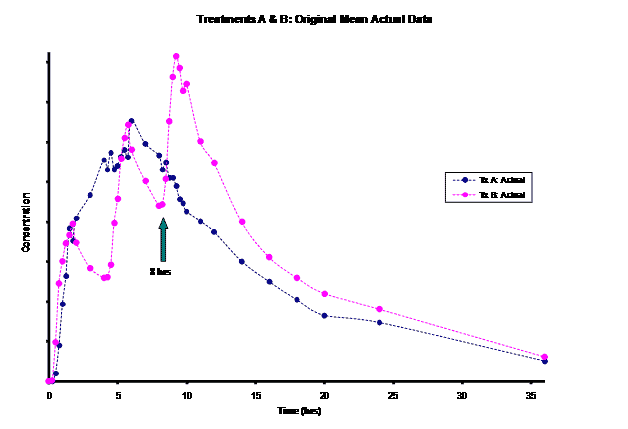
The frequent dosing interval of every 4 hours for Treatment B resulted in truncated information for the terminal phase of this product for the first two doses. This led to difficulty in modeling the elimination rate constant for this product. Most of the information for the Treatment B elimination phase came after the 3rd dose was administered at the 8 hour time-point post dose. Instead of relying on the incomplete concentration-time data from the first dose, an alternative method of modeling the Treatment B PK parameters was necessary for the PK/PD modeling/simulation of steady-state.
Methods
WinNonlin 5.0.1 was used for modeling/ simulation. Both the test product (Treatment A) and RLD (Treatment B) were modeled as a one-compartment drug with 1st order input and 1st order elimination. Pilot concentration-time data (0-36hrs) from 9 subjects were available after a single-dose administration of the test (150mg) and after multiple-dose administrations of the RLD given at 0, 4 and 8 hrs (50mg/dose). For the test, steady-state PK data was simulated based on single-dose modeling data. However, for Treatment B, given the limited, truncated, single-dose data after the first dose (0-4hrs), Treatment B was modeled using the last dose’s concentration-time (8-36hrs) data. This required the exploration of the input dose for this last dose administered to obtain reliable estimates of the model parameters (V, k10, k01) for steady-state simulation. Treatment B was modeled evaluating 60, 75, 90, 100, and 110mg doses. The resulting PK parameters by dose were used to simulate the concentration-time curve from 0-12 hours. Then, the best fitting model based on visual observation and residuals was used to generate a simulation out to steady-state.
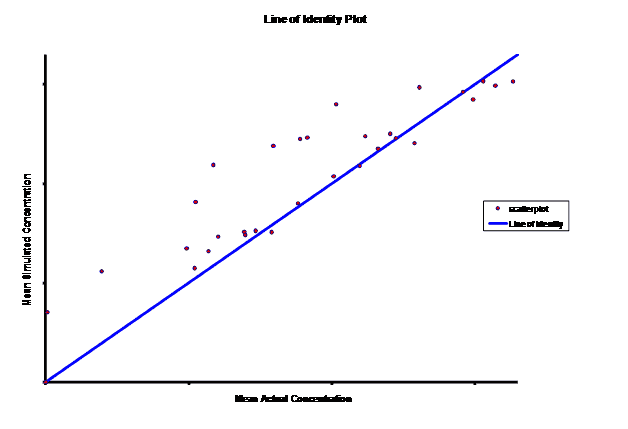
The accuracy and precision of the predictions (of the input dose) was evaluated using the suggestions of Sheiner and Beal.(Sheiner, 1981; Wu, 1995) The root mean squared prediction error (RMSE), was computed as a measure of the precision of the estimates and the mean prediction error (ME), defined in Equation 7, was computed as a measure of the bias of the estimates.
Equation 7
pei = the prediction error of the estimate
N = the total number of concentrations in the population
In the results described below, the ME and the MSE were computed for the RLD (Treatment B) for the 60, 75, 90, 100 and 110 mg doses.
Results
Simulations for PK models from zero to twelve hours with 60, 75, 90, 100, 110 mg Treatment B doses at 8 hours are shown.
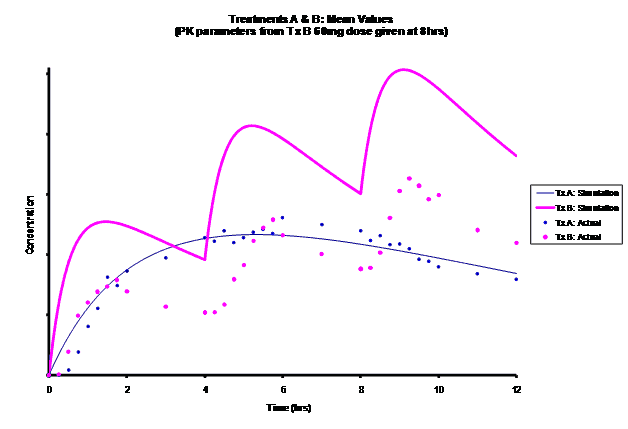
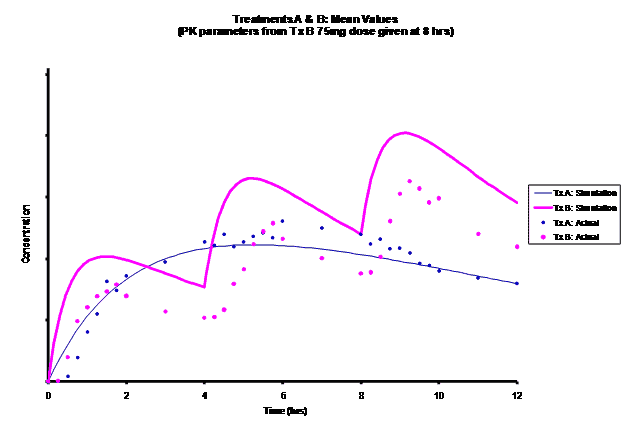

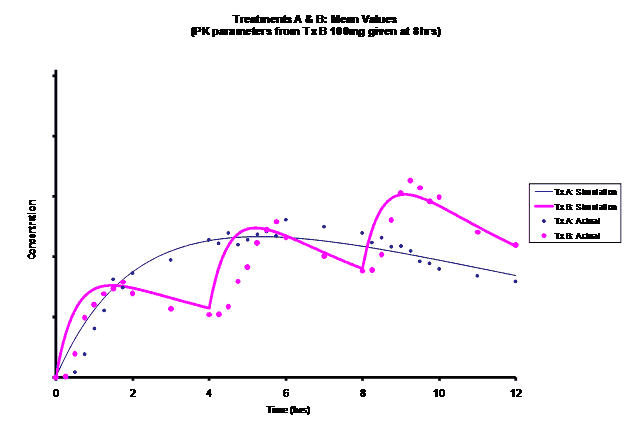
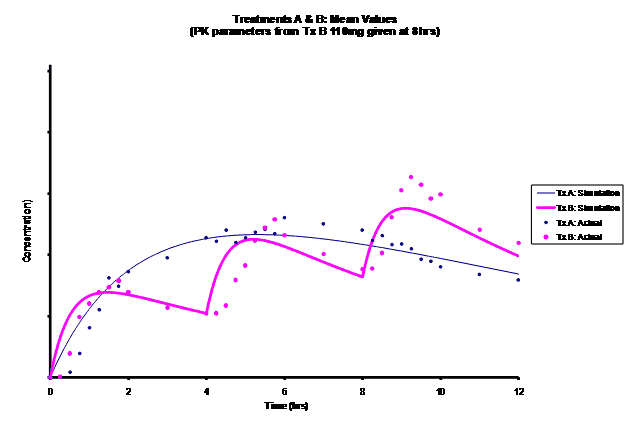
As the input dosage used in the modeling increased, the simulations’ concentrations decreased toward the actual data scatterplot. This can be attributed to the increase in volume that was modeled. Out of the 5 doses evaluated for the RLD, the 100 mg dose input variable showed the best model fit to the observed values.
The predicted concentrations for the 100 mg RLD dose were more accurate, i.e., the mean prediction error was reduced from 89.5 to -11.6 ng∙ml-1 and there was considerable reduction in the magnitude of the variability in the prediction error, i.e., the RMSE was reduced from 84.78 to 20.70 ng∙ml-1 as compared to the other doses used in the modeling.
When evaluating the simulated PK data for the 100 mg dose for the RLD, BE was demonstrated for Cmax, and AUC0-last at steady-state. AUCinf was just outside the upper confidence interval (CI) of 125% (127%) and Cmin,ss was below the lower CI of 80% (70%). While Cmin,ss would not achieve BE with the current test formulation, the mean Cmin,ss value would stay above the reported therapeutic range of the drug substance.
The results of the steady-state PK data that was simulated based on single-dose modeling data allowed the Sponsor to assess the ability of the test formulation to meet the BE requirements for a 505(b)(2) submission, particularly for Cmin,ss. The steady-state data clearly suggests that a potential risk of reformulation may entail Cmax being too high but meeting Cmin,ss BE. The test formulation as currently formulated meets true BE, with both AUC and Cmax within the established CI. C minss may be outside the CI but clearly could be justified since it is maintained above the established therapeutic range of plasma concentrations.
Conclusion
In the absence of actual steady-state data, modeling/simulation results allowed for timely, confident decisions to be made about whether to conduct further pilot studies or to reformulate to meet steady-state pharmacokinetic BE requirements for a 505(b)(2) submission as requested by the FDA. This is an example of how modeling/simulation has enhanced decision making in new drug development.
References
Miller R, Ewy W, Corrigan BW, Ouellet D, Hermann D, Kowalski KG et al. How modeling and simulation have enhanced decision making in new drug development. J Pharmacokinet Pharmacodyn 2005; 32(2):185-197.
Sheiner LB, Beal SL. Some suggestions for measuring predictive performance. J Pharmacokinet Biopharm 1981; 9(4):503-512.
Wu G. Calculating predictive performance: a user’s note. Pharmacol Res 1995; 31(6):393-399.